In 1964 two young American radio astronomers, Arno Penzias and Robert Wilson, made an accidental finding which would win them both the Nobel prize and turned out to be one of the greatest scientific discoveries of the twentieth century.
The story started when Penzias and Wilson were given observing time on a large radio telescope at Bell Labs in New Jersey. The telescope had originally been designed for satellite communications, but with the advances in satellites in the 1960s it had become surplus to requirements.
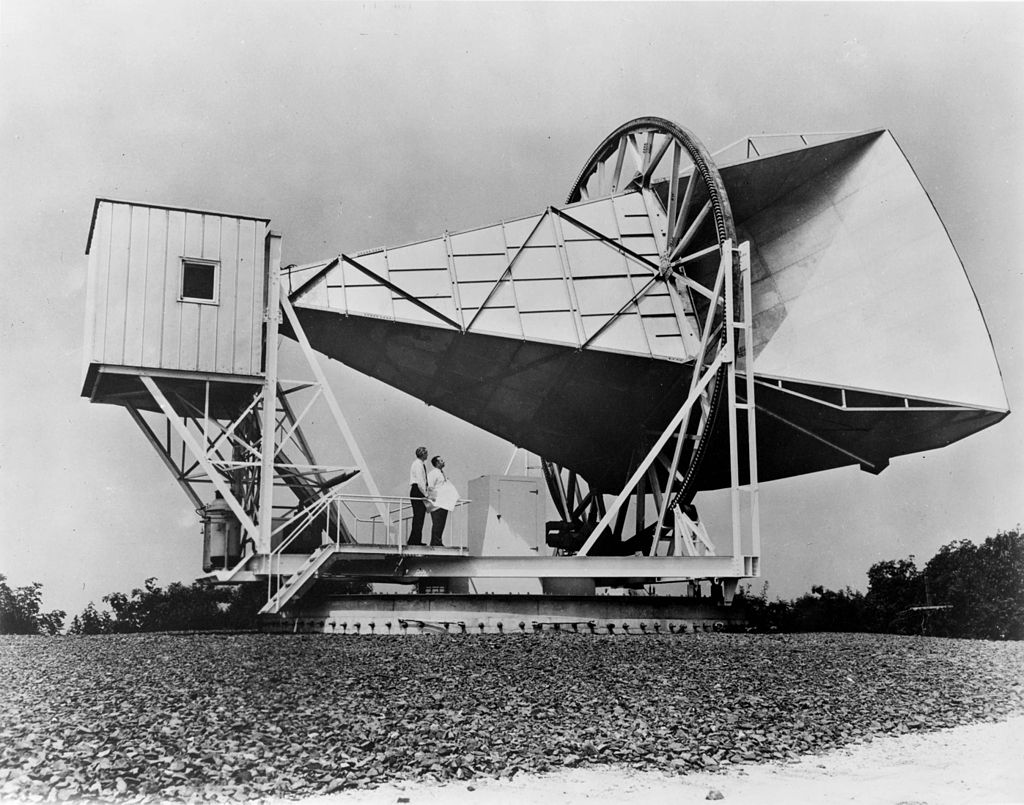
Penzias and Wilson at the telescope where they made their discovery (image from NASA)
They had been intending only to map radio signals from objects in our Milky Way galaxy, but their telescope was sensitive enough to pick up a faint background signal. This signal was unusual in that it had the same strength in all directions and at all times of day. Initially they thought that it was a man made signal but this was quickly ruled out. However, if the signal was originating from space then it should be emitted by an object (such as a galaxy, or a cloud of gas or dust) and be much stronger when the telescope was pointing in the the direction of the object, much weaker when the telescope was pointing away, and would disappear when the object had set below the horizon – but this was clearly not the case. As they continued their investigations they discovered “a white dielectric substance” – pigeon droppings – inside the their telescope. It turned out that some pigeons had decided to roost there. It was possible that this could have produced a false signal, so to remove this possibility they cleaned out the mess and tried removing the pigeons and discouraging them from roosting, but they kept flying back. Unfortunately for the pigeons, they found a more permanent solution to the problem.
“To get rid of them, we finally found the most humane thing was to get a shot gun…and at very close range [we] just killed them instantly. It’s not something I’m happy about, but that seemed like the only way out of our dilemma,” said Penzias. (Levine 2009)
However, even when the pigeon droppings were eliminated, the background noise was still there, so their investigations continued. The cause of this background noise was finally traced to what is known as the cosmic microwave background (CMB) – electromagnetic radiation created when the Universe was only 400,000 years old, long before the first stars and galaxies formed.
Electromagnetic Radiation
You may remember from your high school science lessons that light is a form of electromagnetic (often abbreviated to EM) wave.
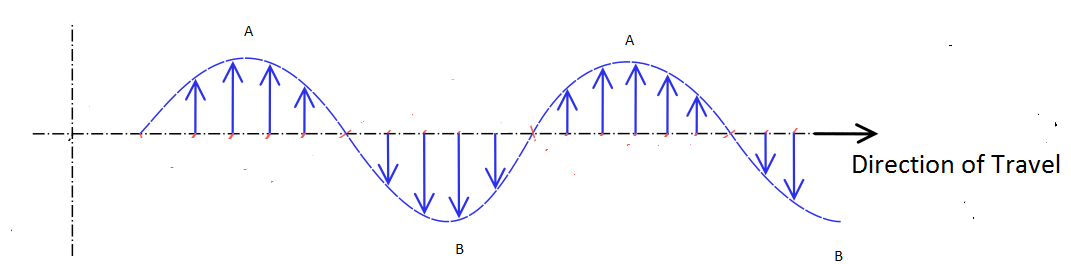
The diagram above shows a wave of visible light. The blue lines show the strength of the invisible field called the electric field (see note 1). The wavelength is the distance between successive peaks, marked as A in the diagram, or successive troughs, marked as B in the diagram. The wavelengths of light waves are so small that they are usually measured in nanometres (normally abbreviated to nm). 1 nm is equal to one billionth of a metre. Visible light which can be detected by the human eye consists of electromagnetic waves with wavelengths in the range 380 nm to 750 nm. The eye sees different wavelengths as different colours.
There are electromagnetic waves which have wavelengths much shorter and much longer than visible light. This can be seen in the diagram below, which shows all the different types of electromagnetic waves in order of their wavelengths and, if you’ve studied physics at high school, you’ll know is called the electromagnetic spectrum

Diagram from NASA
- The waves with the shortest wavelengths, less than 0.01 nm, are gamma rays, which on Earth are normally produced by radioactive materials. Gamma rays are extremely dangerous to living organisms and exposure to gamma rays even at low levels increases the risk of getting cancer.
- X-rays have wavelengths from 0.01 nm to 10 nm. They can easily pass through soft tissue but less easily through bones so are commonly used for medical imaging
- The wavelengths of ultraviolet light (usually abbreviated to UV) lies between X-rays and visible light. Most UV, particularly at the shorter range of wavelengths, is absorbed by the Earth’s upper atmosphere before it hits the ground. However, some UV reaches the Earth’s surface where overexposure can cause sunburn leading to a increased risk of skin cancer.
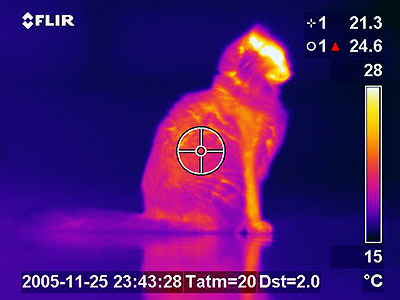
- Infrared radiation (sometimes abbreviated to IR) is radiation with a wavelength longer than visible light. up to about 1 mm. Objects at room temperature emit IR and the warmer they are the more IR they emit. So IR is used in thermal imaging.
- Microwaves have wavelength in the range 1 mm up to 1 metre. Microwaves have many applications including communications, radar, and microwave ovens. Most radio astronomy is carried out at microwave wavelengths.
- Radio waves haves wavelengths over 1 metre. Their main use is to transmit and receive TV and radio signals (see note 2).
There are many devices such as radio transmitters, microwave ovens, suntan lamps, lasers and x-ray machines which are used because they emit EM radiation at one particular wavelength. For example a laser will only emit light of a particular colour. In addition to this, all objects also emit EM radiation called thermal radiation or blackbody radiation over a wide range of wavelengths. When we plot the amount of this thermal radiation emitted by a hot object such as star against the wavelength of the radiation we get a curve with a similar shape to that shown below (see note 3).

Although a star such as the Sun emits a significant amount of radiation over a wide range of wavelengths, you can see from the diagram that there is a clear peak in the visible light part of the spectrum. The maximum radiation is emitted at a wavelength of just over 500 nm, the wavelength of green light.
For all objects the wavelength where the most thermal radiation is emitted depends on its temperature: the hotter the object, the shorter the wavelength. This is shown in the digram below. This curve is known as the Planck spectrum.

The amount of radiation emitted by objects at different temperatures
You will have noticed this for yourself if you have studied a coal fire. Initially when the coals start to get hot they glow a dull red, because most of the radiation is emitted in the infrared and there is only a little visible light. As they get hotter they emit more light at the shorter wavelengths. So the coals glow a brighter red and then finally a bright orange/red when the fire gets really hot.
The table below shows the peak wavelength for a selection of objects at different temperatures and whereabouts in the EM spectrum it is.

Explanation of the cosmic microwave background from the early Universe
As readers of my previous post will know, the generally accepted theory of the origin of the Universe is that it was created in an event known as the Big Bang 13.8 billion years ago. The early Universe was incredibly hot and for the first few hundred thousand years consisted of a special state of matter normally only found at very high temperatures, called a plasma. Rather than consisting of atoms, a plasma consists of a sea of electrically charged particles, called ions and electrons. Light cannot pass through a plasma, and the Universe at this time would have been a hot glowing fog.

A plasma
The whole Universe would have been full of radiation emitted by the ions and electrons. Cosmologists are able to prove that the the amount of radiation emitted by the plasma would have followed a Planck spectrum curve such as those shown below.

As shown in the diagram, as the Universe cooled over time the peak wavelength increased.
- 10 seconds after the Big Bang the temperature of the Universe was 100 billion degrees. The peak wavelength was around 0.00003 nm, well into the gamma ray region of the spectrum. This is shown as A in the diagram.
- 10 hours after the Big Bang the temperature of the Universe had fallen to 100 million degrees. The peak wavelength was around 0.03 nm, in the X-ray region of the spectrum. This is shown as B in the diagram.
- 1000 years after the Big Bang the temperature of the Universe was around 100,000 degrees. The peak wavelength was around 30 nm, in the UV region of the spectrum. This is shown as C in the diagram.
- 400,000 years after the Big Bang, the Universe had cooled to aound 3,000 degrees. The peak wavelength was around 1,000 nm in the infrared region of the spectrum. This is shown as D in the diagram.
At D, the Universe had reached a temperature low enough so that ordinary atoms could exist. At this point in time, which astronomers call the recombination time, the Universe became transparent to radiation, as EM radiation could pass unhindered straight through the hydrogen and helium gases which filled the Universe.
Over the billions of years since that time much of the hydrogen and helium gas which was initially fairly evenly spread out formed into clumps which condensed to form the stars and galaxies we see in the Universe today. Cosmologists have shown that all the EM radiation which filled the early Universe has been stretched out to longer wavelengths by its expansion so that its peak wavelength where the radiation is strongest is now is around 1.1 millimetres in the microwave range, corresponding to a temperature of only 2.7 degrees above the coldest possible temperature absolute zero. This is what we observe today as the cosmic microwave background.
In my next post I talk about the significance of the cosmic microwave background and why it has been important to astronomers in the 50 years since its discovery.
Notes
- Light also has a magnetic field which is always at right angles to the electric field. To simplify the diagram this is not included.
- Some TV transmissions are in the microwave region of the spectrum.
- This diagram is an oversimplification. The curve shown is that of a perfect black body at a temperature of 5,500 degrees Celsius, which is the temperature of the Sun’s surface. In reality, like nearly all objects, the curve of the amount of the Sun’s radiation emitted at each wavelength, shown in yellow in the diagram , doesn’t exactly fit the Planck spectrum, although it is a good approximation If we look at the amount of the Sun’s radiation at different wavelengths which actually reaches the Earth’s surface, then this differs from the Planck spectrum curve even more because different wavelengths are absorbed differently by the Earth’s atmosphere. This is shown in red in the diagram below.


References
Levine, A. G. (2009) The Large Horn Antenna and the Discovery of Cosmic Microwave Background Radiation, Available at:https://www.aps.org/programs/outreach/history/historicsites/penziaswilson.cfm(Accessed: 21 August 2016).

[…] CCC is correct , Penrose predicts there should be bright spots in the microwave background . These are known as Hawking points and are caused by the evaporation of supermassive black holes […]
LikeLike
Well written and informative. Your posts always remind me why science is beautiful.
LikeLike
[…] via The cosmic microwave background: part I — The Science Geek […]
LikeLike
[…] via The cosmic microwave background: part I — The Science Geek […]
LikeLike
[…] discussed in my previous post, the accidental discovery of the cosmic microwave background (CMB) in 1964 by Arno Penzias and […]
LikeLike
Reblogged this on amijkopstein and commented:
Very clear, plain language explanation easy to understand for the layperson.
LikeLiked by 1 person
Thank you
LikeLike
Reblogged this on Mohsen Behnam, PhD and commented:
Interesting!
LikeLiked by 1 person