The is a now an expanded and updated version of this post available at:
https://explainingscience.org/2020/12/10/dark-energy-an-unexpected-finding/
The Expansion of the Universe
Astronomers have known since the late 1920’s that the Universe is expanding. By this we mean that distances between objects which are not bound together by another force, such as gravity, increase over time.

Diagram showing the expansion of a small region of the Universe
The most commonly held view before 1998 was that, although the Universe is expanding, its rate of expansion must be slowing down. There was good reason for believing this, when astronomers applied Einstein’s theory of general relativity to the entire Universe, it predicted that gravity due to the matter in the Universe should slow down its expansion.

The x axis shows the time since the Big Bang. The y axis shows the scale factor of the Universe, which is the relative distance between objects which are moving apart due to the expansion of the Universe.
The Big Crunch?
If the average density of matter in the Universe is greater than a certain value, known as the critical density, then its expansion will eventually stop altogether and it will start contracting, eventually ending in a big crunch in the far distant future.

At the Big Crunch the Universe ends in a singularity where space and time comes to an end – the reverse of the Big Bang.
Before the late 1990’s many cosmologists believed the Universe would end in a Big Crunch.
Measuring the rate of expansion of the Universe
When we look at the spectrum of any star, we see a number of dark or bright lines. The dark lines are known as absorption lines and the bright lines emission lines. Each line is due to an energy transition in a particular type of atom or molecule and always occurs at the same wavelength. For example, the hydrogen alpha spectral line occurs at a wavelength of 656.3 nanometres.
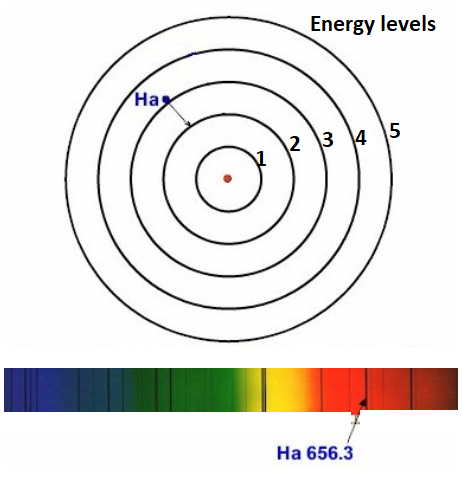
The hydrogen alpha line occurs when an electron moves from energy level 2 to energy level 3 in a hydrogen atom.
However, if a light source is moving away from the observer then all its spectral lines are shifted towards longer wavelengths. This is known as a red shift. If the light source is moving towards the observer, its spectral lines are shifted towards shorter wavelengths. This is known as a blue shift.
The Doppler shift is the fractional change in wavelength due to the motion of the light source and is often given the symbol z.
- If a light source is moving away from us, so a spectral line at wavelength of 500 nanometres is red shifted to a wavelength of 505 nanometres, then the change in wavelength is +5 nanometres and the Doppler shift (z) is:
+5/500 = 0.01
- If an object is moving towards us, so a spectral line at wavelength of 600 nanometres is blue shifted to a wavelength of 597 nanometres, then the change in wavelength is -3 nanometres and the Doppler shift (z) is:
-3/600 = -0.005

If the light source is moving at a small fraction of the speed of light, then the velocity (v) it is moving away from or towards us is given by:
v = cz
Where c is speed of light.
If we measure the velocity that galaxies are moving with respect to us, calculated from the Doppler shift of their spectral lines, and plot it against their distance, then we get the relationship shown below.

Note: Nearby galaxies in the Local Group which are gravitationally bound to the Milky Way have been excluded from the diagram.
As you can see all the galaxies are moving away from us, showing the Universe is expanding, and. there is a clear relationship between the recessional velocity and the distance of a galaxy. This relationship, called Hubble’s Law named after the American astronomer Edwin Hubble (1889-1953) who discovered it in 1929, is:
v = HoD
where
- v is the velocity an object is moving away from us
- D is the object’s distance and
- Ho is a constant known as the Hubble constant. If v is measured in km/s and D is in megaparsecs (1 Mpc =3.26 million light years) then Ho is approximately 70 km/s per Mpc. The Hubble constant measures how fast the Universe is expanding. (This is more accurately called the Hubble parameter because it can vary over time)
It is
Validating Hubble’s law
In order to validate Hubble’s law, astronomers need to accurately measure the distance of objects far outside our own Milky Way galaxy. This is done by using standard candles. These are objects which have a well-defined absolute brightness and by measuring their apparent brightness we can determine how far away they are. Some of the standard candles used by astronomers are given below.
Cepheid variables
These are variable stars, which change brightness over a period of days in a regular pattern. There is a relationship between the period of a Cepheid variable and its absolute brightness. Once the absolute brightness is known you can work out the distance to the galaxy the Cepheid is located in from its apparent brightness.
Cepheid variables are bright enough to measure distances up to 25 Mpc.
Novae
A nova (plural novae) is a transient astronomical event that causes a sudden massive increase in the brightness of a relatively faint star to between 70,000 to 250,000 times the luminosity of the Sun. After the star hits its peak brightness it fades over several months. Studies of nearby novae have indicated that regardless of the peak luminosity achieved, after 15 days all novae have the same brightness – about 12,500 times that of the Sun. By measuring the apparent brightness of a novae in a galaxy after 15 days, it is possible to determine its distance.
Novae can be used to measure distances up to 20 Mpc
Globular Clusters
A globular cluster is a tightly packed group of stars of a similar age. Large globular clusters contain hundreds of thousands of stars.
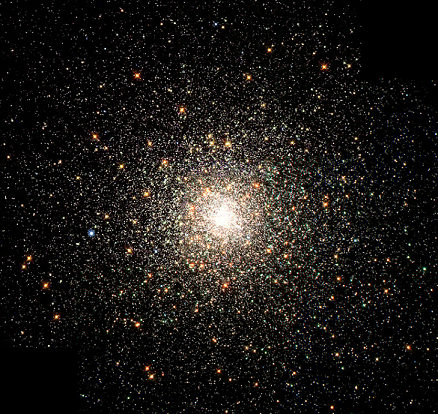
M80 – A large globular cluster in our own Milky Way galaxy.
The brightest globular clusters all have approximately the same luminosity, one million times the luminosity of the Sun. This can give an estimate of the distance to the globular cluster from its apparent brightness.
Globular clusters can be used to measure distances up to 50 Mpc
Tully Fisher relations
Tully Fisher (TF) relations are relationships between the width of the spectral lines to the luminosity (or mass) of a spiral galaxy.
TF relationships can be used to measure distances up to approximately 100 Mpc
I will discuss TF relationships in a future post.
Hubble’s law at high redshifts
Distance measurements using standard candles have validated Hubble’s law for distances of at least 100 Mpc. If we study objects at high redshifts, where the recessional velocity is a large fraction of the speed of light then we are looking at objects billions of light years away. The light from them was emitted billions of light years ago. If we estimate the Hubble parameter for these objects, we are measuring the Universe’s expansion billions of years ago. To do this we need a standard candle which is bright enough to be visible billions of light years away. Such a candle exists – type 1a supernovae (SN). The evolution of a type 1a SN is shown below.

When a white dwarf approaches the Chandrasekar limit (1.44 solar masses) it can reach a point where runaway nuclear fusion occurs. This releases an enormous amount of energy in a short time, totally destroying the star and blasting a cloud of plasma into space. Because the detonation of the white dwarf occurs at a particular mass, all type 1a SN have a similar maximum brightness – about 5 billion times brighter than the Sun, although this varies a little
The American astronomer Philips in 1993 derived a formula to accurately estimate the maximum brightness of a Type 1a SN based upon the decline in apparent brightness 15 days after the peak. This allowed the use of Type 1a SN as accurate standard candles.
However, type 1a SN are rare events. On average one explodes in a galaxy the size of ours every 500 years. To be guaranteed a discovery on any given night requires searching hundreds of thousands of galaxies. Such wholesale searching has been made possible by the development of large area charge-coupled device (CCD) detectors and mosaics of CCDs used at the focuses of large telescopes
The high z survey
Between 1994 and 1998 twenty astronomers located in America, Europe, Australia and Chile looked at 16 high red shift supernovae. The survey went all the way up to z=0.9 (a recessional velocity of 56% of the speed of light) . They used the Philip’s relationship, talked about earlier, to estimate the absolute brightness of the type 1a SNs and knowing the absolute brightness calculated their distance from their apparent brightness. The results are given in a simplified form below, What is is clear is that the slope of the graph id very different that it would be if the expansion of the Universe is slowing down

From these observations the team made the following conclusions.
- The Hubble constant, which measures the rate of expansion of the Universe, was lower billions of years ago than id if the rate of expansion of Universe is slowing down
- Therefore, the rate of expansion of the universe is speeding up
- Since the effect of all the matter in the Universe should slow down its expansion something else must be accelerating it.
- This unknown energy speeding up the expansion of the Universe is dark energy.
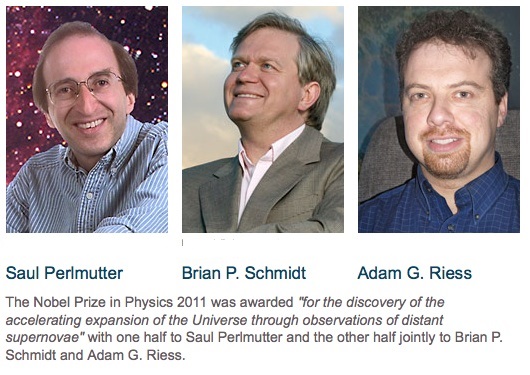
This was such an important finding that Brian Schmidt and Adam Reiss from the High z project together with Saul Perlmutter from the related supernova cosmology project won the Nobel Prize for physics in 2011, 13 years later. The 13-year delay is typical. Science Nobel prizes are normally awarded a significant time after a major discovery because the discovery has to be generally accepted and its overall importance assessed by the scientific community.
How much dark energy is there in the Universe?
Energy and mass are equivalent using Einstein’s famous equation E = mc2. So the amount of dark energy is usually expressed as a matter density. To provide the measured acceleration the average density of dark energy in the Universe is only ~7 × 10⁻²⁷ kg/m3 . This is an extremely low value – equivalent to four atoms of hydrogen per cubic metre. However, because the Universe is mostly empty space it is still enough for dark energy to be its dominant constituent.

What is dark energy?
The simple answer is that we don’t know! I discussed this in a previous post An overview of Dark energy in which I mentioned that one explanation is something called the cosmological constant. This introduced by Einstein back in 1917 but later disregarded, but this is only a possible explanation and, at the moment, one of the greatest mysteries of physics is:
What is most of the universe made up of?
Reference
Philips, M M (1993) The absolute magnitudes of type IA supernovae, Available at: http://articles.adsabs.harvard.edu/full/1993ApJ…413L.105P (Accessed: 30 November 2019).

Can U please explain what they mean/t by
“The distant SNs’ were fainter/dimmer and therefore further away than expected”?
Relative to what? Their red shifts?
Is that because H(t) had changed, from H0, or simply because z increases linearly, and I/ntensity decreases as the inverse-square with distance?
LikeLike
[…] …the unexpected finding made in the late 1990’s that the rate of expansion of the Universe is increasing due to dark energy…was totally unexpected and won its discoverers the Nobel prize for physics…Between 1994 and 1998 twenty astronomers located in America, Europe, Australia and Chile looked at … […]
LikeLike
Derivation of Hubble’s Law and the End of the Darks Elements
https://www.scirp.org/html/91689_91689.htm
LikeLike
“The 13-year delay is typical. Science Nobel prizes are normally awarded a significant time after a major discovery”
This biggest Nobel mistake of Dark Energy (DE) repeated in 2019 took cosmology back to Ptolemy age of epicycles. Despite 2 books, papers and annual seminars by science society sites established by Suntola Dynamic Universe (DU) structural system.
DE/DM epicycle mistakes were caused by the main SR,GR and QM flaw of postulated eternally constant speed c of light IN space and its disconnection from the decelerating expansion speed C4 OF space. They caused distorted distance R4 and cosmic time T4 in cosmology diluting the GR based power density of SN 1a together with emit-time dependent Planck constant.
The Lambda based model adopted the epicycle estimation process of Earth centered view by 1) using biased GR physical model prediction by factor of 4 dilution and 2) then fitting empirical correction terms of DE/DM densities to remaining residual bias. DU physical model directly fit observed values without any epicycles, like Sun centered model 400-500 years. No DE/DM are found after 20 yr waste of time and expensive efforts.
LikeLike
[…] LSST survey should improve our understanding of dark energy and dark matter by studying three areas of […]
LikeLike
So….dark energy is detected making the expansion of the universe increase in speed….? I just wonder what effects it has that we can’t detect at our plodding human scale! I’ll need to read a few times to get it all sunk in.
LikeLiked by 2 people
Thanks for your comment.
I hope I’ve explained dark energy clearly in this post.
Steve
LikeLike
Dark energy is what dark energy does (free after John Kenneth Galbraith).
LikeLiked by 1 person
An interesting thought !!!
LikeLike
By the way, if it was dicovered already it wouldn’t be dark anymore wouldn’t it? 🙂
LikeLiked by 2 people
😉
LikeLike
This is one of those times I wish I could be around for when the universe can’t expand any further. 🙂
LikeLiked by 1 person
Yes that that would be interesting 😉
LikeLiked by 1 person
[…] Source link […]
LikeLike
The truth is often stranger than fiction and this excellent short summary proves the old saying.
The speeds these distant huge galaxies move at seems unbelievable but then I suspect our own milky way is rushing through space and we carry on oblivious of all motion.
LikeLiked by 2 people
Thank you.
The fact that the Universe’s expansion is speeding up was a totally unexpected finding.
LikeLike
Nice work laying out the current consensus of Modern Astronomy.
keep in mind there is an alt. outside the current assumption premise, where the universe reached mature size and density relatively early.
reference ‘SPIRAL cosmological redshift hypothesis and model’, vol. II of the YeC ‘Moshe Emes’ series for Torah and science alignment.
LikeLiked by 1 person
in SPIRAL one would predict the prevalent CR and overall increase of CR w/ distance w/o predicting or requiring any dark energy. As cosmic expansion ended by/ with cosmic inflation expansion.
LikeLiked by 1 person
here is how SPIRAL and the current SCM-LCDM compare on several issues, plus some of the testable predictions to help confirm (or falsify) SPIRAL a valid explanation of the empirical observations. http://www.academia.edu/36013854/SPIRAL_Cosmological_Model_snapshot
LikeLiked by 1 person
Thanks Steve for a very concise and easily understandable explanation of the discovery of dark energy – surely the most surprising and mystifying cosmological discovery of our time!
LikeLiked by 3 people
Thank you.
The fact that the Universe’s expansion is speeding up was a totally unexpected finding.
Hopefully within the next 20 years will find out more about the true nature of dark energy.
LikeLiked by 1 person