I offered recently to write an article for my local astronomy society on the discovery of dark energy. It is an expanded version of the blog post I wrote on the topic last year and, at over 3000 words, it is longer than my usual posts. I thought it would be of interest to many readers so I’ve decided to publish it here.
Astronomers have known since the late 1920’s that the Universe is expanding. By this we mean that distances between objects which are not bound together by another force, such as gravity, increase over time.

Diagram showing the expansion of a small region of the Universe
The commonly held view before 1998 was that, although the Universe is expanding, its rate of expansion must be slowing down. There was good reason for believing this, when astronomers applied Einstein’s theory of general relativity to the Universe, it predicted that gravity due to the matter in the Universe should slow down its expansion.
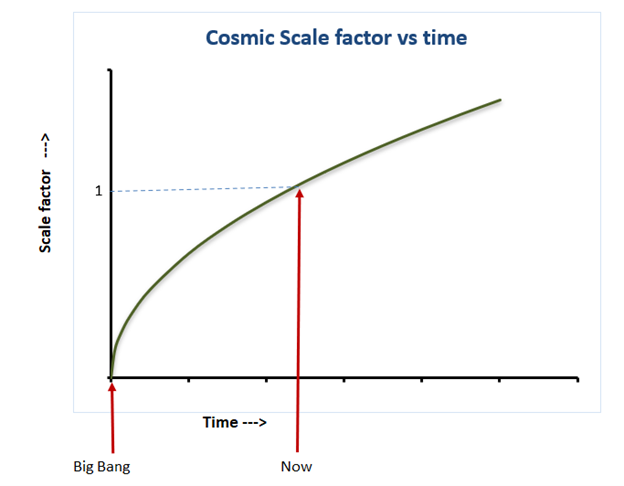
Measuring the expansion – the cosmic scale factor
If we consider two objects which are far enough away from each other so that they are not bound together by gravity, or any other force, for example two clusters of galaxies which are 100 million light years apart, then, due to the expansion of the Universe, these two objects will gradually get further and further apart.
.
If we assume that their current distance apart is do and their distance at a time t is d(t) (where t can be any time in the past or the future) then the cosmic scale factor, which is normally given the symbol a(t) is defined as:
a(t) = d(t) / do
So, the value of the cosmic scale factor is the ratio of their distance at time t to their current distance.
The cosmic scale factor is
- equal to zero at t=0, the exact instant of the Big Bang
- equal to one at the current age of the Universe (t = to )
Clearly, as the Universe expands the cosmic scale factor increases,
Will there be a Big Crunch?
If the average density of matter in the Universe is greater than a certain value, known as the critical density, then its expansion will eventually stop altogether and it will start contracting, eventually ending in an event known as the Big Crunch in the far distant future.

At a distant time in the future known as the Big Crunch the Universe ends in a singularity where space and time comes to an end. Essentially this is the reverse of the Big Bang.
Before the late 1990’s many cosmologists believed the Universe would end in a Big Crunch.
Hubble’s law and the Hubble parameter
When we look at the spectrum of any star, we see a number of dark or bright lines. The dark lines are known as absorption lines and the bright lines emission lines. Each line is due to an energy transition in a particular type of atom or molecule and always occurs at the same wavelength. For example, the hydrogen alpha spectral line occurs at a wavelength of 656.3 nanometres. (One nanometre which is usually abbreviated to nm is one billionth of a metre)
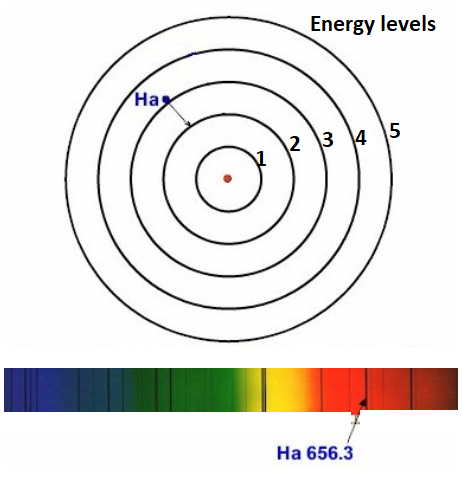
The hydrogen alpha line occurs when an electron moves from energy level 2 to energy level 3 in a hydrogen atom or vice versa.
However, if a light source is moving away from the observer then all its spectral lines are shifted towards longer wavelengths. This is known as a red shift. If the light source is moving towards the observer, its spectral lines are shifted towards shorter wavelengths. This is known as a blue shift.
The Doppler shift is the fractional change in wavelength due to the motion of the light source and is often given the symbol z.
- If a light source is moving away from us, so a spectral line at wavelength of 500 nanometres is red shifted to a wavelength of 505 nanometres, then the change in wavelength is +5 nanometres and the Doppler shift (z) is:
+5/500 = 0.01
- If an object is moving towards us, so a spectral line at wavelength of 600 nanometres is blue shifted to a wavelength of 597 nanometres, then the change in wavelength is -3 nanometres and the Doppler shift (z) is:
-3/600 = -0.005

If the light source is moving at a small fraction of the speed of light, then the velocity (v) it is moving away from or towards us is given by:
v = cz
Where c is the speed of light.
If we measure the velocity that galaxies are moving with respect to us, calculated from the Doppler shift of their spectral lines, and plot it against their distance, then we get the relationship shown below.

Note: Nearby galaxies in the Local Group which are gravitationally bound to the Milky Way have been excluded from the diagram. The Megaparsec (Mpc) is a unit used by astronomers when measuring distances at galactic scales. One Mpc is equal to 3.26 million light years
As you can see all the galaxies are moving away from us, due to the expansion of the Universe. There is a clear relationship between the recessional velocity and the distance of a galaxy. This relationship is
v = HoD
where
- v is the velocity an object is moving away from us
- D is the object’s distance and
- Ho is a constant known as the Hubble constant. If v is measured in km/s and D in megaparsecs then Ho is approximately 70 km/s per Mpc. The Hubble constant measures how the recessional velocity of an object varies as a function of its distance.
This relationship is known as Hubble’s Law after the American astronomer Edwin Hubble (1889-1953) who discovered it in 1929.
As the Universe evolves the value of the Hubble constant changes over time. For that reason, it is more accurately called the Hubble parameter H(t), where t is the time since the beginning of the Universe. The Hubble constant Ho is the value of the Hubble parameter we measure today.
Validating Hubble’s law
In order to validate Hubble’s law, astronomers need to plot recessional velocity against distance over a large range of distances. To do so they need to be able to accurately measure the distances of objects far outside our own Milky Way galaxy. This can be done by using standard candles. These are objects which have a well-defined absolute brightness and by measuring their apparent brightness we can determine how far away they are. Some of the standard candles used by astronomers are given below.
Cepheid variables
These are variable stars, which change brightness over a period of days in a regular pattern. There is a relationship between the period of a Cepheid variable and its absolute brightness. Once the absolute brightness is known you can work out the distance to the galaxy the Cepheid is located in from its apparent brightness.
Cepheid variables are bright enough to measure distances up to 25 Mpc.
Novae
A nova (plural novae) is a transient astronomical event that causes a sudden massive increase in the brightness of a relatively faint star to between 70 000 to 250 000 times the luminosity of the Sun. After the star hits its peak brightness it fades over several months. Studies of nearby novae have indicated that regardless of the peak luminosity achieved, after 15 days all novae have the same brightness – about 12 500 times that of the Sun. By measuring the apparent brightness of a nova in a galaxy after 15 days, it is possible to determine its distance.
Novae can be used to measure distances up to 20 Mpc
Globular Clusters
A globular cluster is a tightly packed group of stars of a similar age. Large globular clusters contain hundreds of thousands, or even millions, of stars.
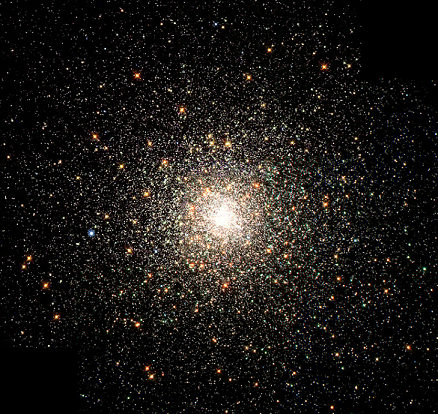
M80 – A large globular cluster in our own Milky Way galaxy.
Globular clusters can be used as standard candles because the very brightest globular clusters found in a galaxy all tend to have approximately the same luminosity – approximately one million times that of the Sun. This can give an estimate of the distance to the globular cluster from its apparent brightness.
Globular clusters can be used to measure distances up to 50 Mpc
Tully Fisher relations
Tully Fisher (TF) relations are relationships between the width of the spectral lines to the luminosity (or mass) of a spiral galaxy.
TF relationships can be used to measure distances up to approximately 100 Mpc
To keep this article at a reasonable length 😉 I will discuss TF relationships in a future article.
Estimating distances at higher redshifts
Distance measurements using standard candles have validated Hubble’s law for distances up to ~100 Mpc. If we study objects at higher redshifts, where the recessional velocity is a large fraction of the speed of light then we are looking at objects billions of light years away. The light from them was emitted billions of light years ago. If we estimate the Hubble parameter for these objects, we are measuring its value billions of years ago and, because the Universe is evolving over time, we would not expect it to be the same value as we measure today. To measure how the expansion of the Universe has changed over its lifetime we need a standard candle which is bright enough to be visible billions of light years away. Such a candle exists – type 1a supernovae (SN). The evolution of a type 1a SN is shown below.

When a white dwarf approaches the Chandrasekar limit (1.44 solar masses) it can reach a point where runaway nuclear fusion occurs. This releases an enormous amount of energy in a short time, totally destroying the star and blasting a cloud of plasma into space. Because the detonation of the white dwarf occurs at a particular mass, all type 1a SN have a similar maximum brightness – about 5 billion times brighter than the Sun, although this varies a little
The American astronomer Philips in 1993 derived a formula to accurately estimate the maximum brightness of a Type 1a SN based upon the decline in apparent brightness 15 days after the peak. This allowed the use of Type 1a SN as accurate standard candles.
However, type 1a SN are rare events. On average one explodes in a galaxy the size of ours every 500 years. To be guaranteed a discovery on any given night requires searching hundreds of thousands of galaxies. Such wholesale searching has been made possible by the development of large area charge-coupled device (CCD) detectors and mosaics of CCDs used at the focuses of large telescopes
The deceleration parameter.
One important number, which measurements of very distant objects should allow us to estimate is the deceleration parameter. It is usually given the symbol q(t) and indicates how the rate of expansion of the Universe is changing.. The diagram below illustrates different values of the deceleration parameter.

Along the horizontal axis is the age of the Universe measured on a scale where its current age (to – roughly 13.8 billion years) is given a value of 1. Along the vertical axis is the cosmic scale factor a(t). As discussed previously:
- at the instant of the Big Bang (time =0), a(t)=0
- at the present age of the Universe (time = to), a(t) = 1 .
The deceleration parameter indicates how the rate of change of the cosmic scale factor varies over time. The three lines of the graph illustrate three cases.
- The red line illustrates a deceleration parameter of zero – the cosmic scale factor continues to increase at a constant rate, the Universe’s expansion is neither speeding up nor slowing down.
- The grey line illustrates a deceleration parameter greater than zero- the rate of expansion of the Universe is slowing down.
- The yellow line illustrates a deceleration parameter greater than zero the rate of expansion of the Universe’s is speeding up.
In nearly all models of the Universe the deceleration parameter changes with time. Its current value is given the symbol qo. Until recently it has been very hard to measure accurately. In the Cosmology textbook I used as an undergraduate over 35 years ago the deceleration parameter was stated as being somewhere between 0.0 (where there is no deceleration the Universe expands at a constant rate) and 2.0 (a rapid deceleration leading to a Big Crunch ending) .
The same book gave a quote from the American astronomer Allan Sandage (1926- 2010) that
“at present [the book was actually published in 1976] none of this can be taken very seriously…” .
By the early 1990’s the best estimates of qo. were that it was somewhere in the range 0.2 to 0.6.
Measuring the deceleration parameter from Type 1a SN
The deceleration parameter is related to the Hubble parameter H(t) by the following relationship.
q(t) = – H’(t)/ H(t)2 -1
Where H’(t) is the rate of change of the Hubble parameter over time.
For those of you wanting more mathematical detail see the notes at the end of this article.
Between 1994 and 1998 twenty astronomers located in America, Europe, Australia and Chile looked at 16 high red shift supernovae. The survey went all the way up to z=0.9 (a recessional velocity of 56% of the speed of light) . They used the Philip’s relationship, mentioned above, to estimate the absolute brightness of the type 1a SNs and calculated their distance from their apparent brightness. The results are illustrated in a simplified form below.

For nearby galaxies, Hubble’s Law applies and the graph is a straight line. But at greater distances we would not expect Hubble’s law to apply. Interestingly, even with a rapidly expanding Universe, the value of the Hubble parameter will get smaller over time, for reasons given in the notes at the bottom of the post.
.
If we assume that the deceleration parameter was around 0.5 then at great distances (corresponding to billions of years ago) the data should fit line A. However, the results fitted line B better, indicating that when looking at galaxies a long distance away, their recessional velocity was lower than would be expected.
From these observations it is possible to make the following conclusions.
- The Hubble parameter was lower billions of years ago than it would be if qo were around 0.5
- A better fit to their data was achieved if qo is less than zero, indicating that the rate of expansion of the Universe is speeding up. In fact the current estimates of qo indicate that it is around – 0.6, although there is a significant error margin in this figure.
- Since the effect of the matter in the Universe should slow down its expansion there must be some form of energy speeding it up.
This unknown energy speeding up the expansion of the Universe is dark energy.
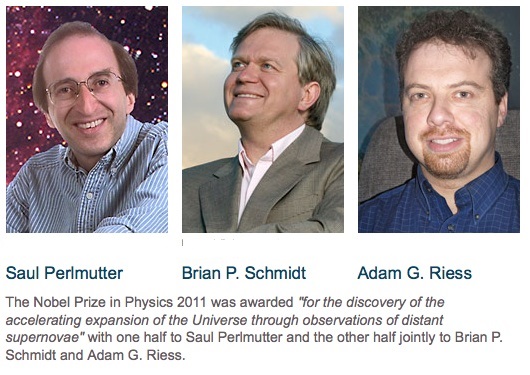
This was such an important finding that Brian Schmidt and Adam Reiss from the High z project together with Saul Perlmutter from the related supernova cosmology project won the Nobel Prize for physics in 2011, 13 years later. The 13-year delay is typical. Science Nobel prizes are normally awarded a significant time after a major discovery because the discovery has to be generally accepted and its overall importance assessed by the scientific community. Since their finding other evidence including the large scale structure and studies of the cosmic microwave background radiation have provided additional evidence for the existence of dark energy
How much dark energy is there in the Universe?
Energy and mass are equivalent using Einstein’s famous equation E = mc2. So the amount of dark energy is usually expressed as a matter density, rather than an energy density. To provide the measured acceleration the average density of dark energy in the Universe is only ~7 × 10⁻²⁷ kg/m3 . This is an extremely low value – equivalent to four atoms of hydrogen per cubic metre. However, because the Universe is mostly empty space it is still enough for dark energy to be its dominant constituent.

What is dark energy?
The simple answer is that we don’t know for sure. I discuss this in my blog post An overview of Dark energy . One explanation is the cosmological constant, which was introduced by Einstein back in 1917 but he later disregarded it , but this is only a possible explanation and, at the moment, one of the greatest mysteries of physics is :
What is most of the universe made of?
References
Philips, M M (1993) The absolute magnitudes of type IA supernovae, Available at: http://articles.adsabs.harvard.edu/full/1993ApJ…413L.105P (Accessed: 30 November 2020).
Further mathematical detail
The deceleration parameter
As discussed previously, the distance d(t) at a time t of an object moving away from us due to the expansion of the Universe, is given by:
d(t) = do.a(t)
where do is the distance of the object at the current age of the Universe (to) and a(t) is the cosmic scale factor.
The deceleration parameter is a dimensionless number and is defined as:

Where a’(t) is the first derivative of a(t), a’’(t) is the second derivative. The minus sign means that if the second derivative is negative, which means the rate of increase of a(t) is slowing down, then q(t) will be positive.
Over the last sixty years or so, most models of the Universe have had a deceleration parameter between -1 (which is a rapidly increasing exponential acceleration) and +3 which is a rapid deceleration. If the deceleration parameter is lower than -1 it cause some interesting challenges because it would mean that there is a faster than exponential expansion.
The Hubble parameter H(t) is equal to the recessional velocity divided by the distance. If we have an object a distance d(t) away then
d(t) = doa(t)
The recessional velocity v(t) at a distance d(t) is given simply by differentiating which gives
d’(t) = doa’(t)
Therefore, the Hubble parameter is given by.

If we differentiate the above expression, using the product rule, with u = a’(t) and v= 1 / a(t), then we get

Multiplying both sides of equation 3 by the following factor

gives

Using the definitions of q(t) and H(t) given in equations 1 and 2 gives

A simple example
If we have a Universe, with an accelerating expansion in which the scale factor increases as the time squared:
a(t) = (t/to)2 (In reality the scale factor will be a more complex function of time than this).
Then a’(t) = 2t/to2 and a’’(t) = 2/to2
Then from equation 1 the deceleration parameter q(t) is:

Which simplifies to q(t) = – ½ . The value is negative indicating an accelerating expansion
The Hubble parameter H(t) from equation 2 is:
Which simplifies to H(t) = 2/t. As the value of the Hubble parameter is inversely dependent on t, its values decreases with time.

Why is it that:
“If the expansion is slowing down, the velocity of a distant galaxy would be
relatively greater than the velocity predicted by Hubble’s law.
If the expansion is speeding up, the distant galaxy’s velocity would fall
below the predicted value. Or, to put it another way, a galaxy with a given
recession velocity will be farther away than expected—and hence fainter—if
the universe is accelerating.”
I feel like Costello in the “Who’s on first, base” comedy sketch/routine!
Can U please explain it, to me, in plain English/simple terms,
that/which even a child can understand, coz that is what I have to do.
What is what, why and how?
LikeLike
I know it can be hard concept to grasp.
So I what will do it create an additional page on my website which explains in plain English to answer to your question. I probably won’t have the time to do this until next month. I’ll Update this comment when I’ve created this page
LikeLike
[…] they would arrive back at their starting point. This is because the Universe is expanding, and the rate of expansion is increasing As they continued their journey, the distance they would need to travel to get back to their […]
LikeLike
[…] energy is a form of energy needed to explain why the expansion of the Universe is speeding up. Without dark energy, gravity due to all the matter in the Universe would slow down its […]
LikeLike
[…] dark energy . It is dark energy which causes the expansion of the Universe to speed […]
LikeLike
[…] described previously the Universe is expanding. The further away an object is the faster it is receding from […]
LikeLike
“The average density of the universe”. if density is mass / volume how can this increase if all the matter that could exist was created at the Big Bang and it’s now getting stretched out over a larger area?
LikeLike
Just the bit in the Big Crunch. How can the average density ever get above the critical density in an expanding universe?
LikeLike
The effect of the matter in the Universe is to slow down its explanation. In effect the greater the average density of matter in the Universe the greater its expansion is slowed down.
In the Big Crunch scenario the current density of matter in the Universe is sufficiently high that eventually, at some time in the far future, not only is the expansion slowed but it stops altogether. After this point the matter in the Universe causes it to start to contract. (i.e the scale factor gets smaller).
It is important to realise that no new matter is created as the Universe contracts . What happens is that space itself shrinks (which can be hard concept to get your head round) if we take a large volume of space containing many stars galaxies etc then this volume gets smaller. Objects such as galaxies, even if they are not bound tother by gravity, will start getting closer together. As the same amount of matter is squeezed into a smaller volume its density rises.
Although the Big Crunch scenario was popular until the late 1990’s, it is not supported by observations which show that the expansion of the Universe is speeding up not slowing down.
I hope this answers your question
Steve
LikeLike
Thanks Steve; great article.
In an item of this length the odd typo is inevitable:
Below the picture of M80 there’s some missing wording. (You were possibly intending to say that its brightness approached the value that would make it useful as a standard candle (for some extremely distant aliens!))
Re: the future evolution of the universe:
I don’t know if you’re familiar with Robert Frosts poem ‘Fire and Ice’ written in the 1920s
I hope I’m quoting correctly!
————–
Some say the world will end in fire
Some say in ice.
From what I’ve tasted of desire
I hold with those who favor fire!
But … if it had to perish twice
I think I know enough of hate
To say that ice is great – and would suffice.
————-
not a bad interpretation of the cosmology of the time!
Please excuse the following; it’s slightly off topic but …
You show a hydrogen atom & highlight an electron moving between orbits. Some of your readers might wonder if not only a photon is emitted, but also a graviton (the electron had a non-zero mass & it made a sudden movement). If they’d not been instructed in the ‘Copenhagen intrerpretation’ they might also wonder whether it was ever between orbits & how long it took to accelerate etc. They might also note that a photon could be absorbed as well as emitted but might wonder if, in the interests of symmetry the same could be said of the graviton.
LikeLiked by 1 person
Thank you David for your (very thorough) comment.
Robert Frost’s poem was certainly ahead of its time!!
LikeLike
[…] https://explainingscience.org/2020/12/10/dark-energy-an-unexpected-finding/ […]
LikeLike