15 December 2025 This orginal post has been revised and updated. However, a new version is at Opportunities for solar energy
In this post I’ll talk about some of the science behind this interesting fact and I’ll also discuss how solar energy is likely to become more important to us in the future.
The facts behind this amazing statistic
The Sun generates energy by nuclear reactions which occur at its dense hot core .It produces a massive 382.8 trillion trillion (3.828 x 1026 ) watts of electromagnetic radiation (Williams 2018) mostly in the form of visible light, infrared and ultraviolet. As you get further from the Sun, the intensity, which is power per unit area falls as the square of the distance
The solar constant is the average intensity of the Sun’s radiation at a distance of 1 astronomical unit (the average distance of the Earth from the Sun). It has a value of 1,361 watts per square metre (W/m2). In fact, the output of the Sun is variable and fluctuates by 0.1% around this value.

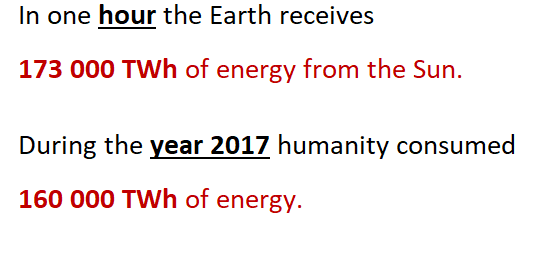
The total energy hitting the Earth in one hour (in watt-hours) is
solar constant x surface area of Earth-sized disc
1 361 W/m2 x 1.2748 x 1014 m2 = 1.73 x 10¹⁷ watt-hours.
This is often expressed as 173,000 terawatt hours (TWh), where 1 terawatt is 1 trillion (1,000,000,000,000) watts
The total energy consumed by humanity in 2017 was slightly less than this at 160,000 TWh (Enerdata 2018). This figure includes not just energy used to generate electricity, but also energy used:
- directly for heating (for example by burning firewood, coal, oil or gas),
- for transport (mainly petrol, diesel and aviation fuel) and
- energy used in industrial processes.
The total amount of electrical energy consumed in 2017 was approximately 22,000 TWh.
The potential for solar energy.
There are two different ways of generating electricity from sunlight. One way is to concentrate the Sun’s energy using mirrors onto a small area and use the heat generated to produce steam to turn a turbine which generates electricity. The other way is use arrays of photovoltaic cells (more commonly known as solar panels) to generate electricity directly from sunlight.
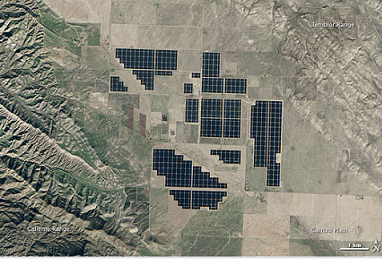
A photo taken from space of the Topaz solar farm in California. It covers an area of 19 km2 (not all of which is covered with solar panels) and generates around 1.25 TWh of electricity per annum.
The majority of solar electricity is produced using solar panels. Much of it in solar farms like the one in California shown above. As prices of solar panels continue to fall and their efficiency increases the amount of electricity generated this way will continue to go up.
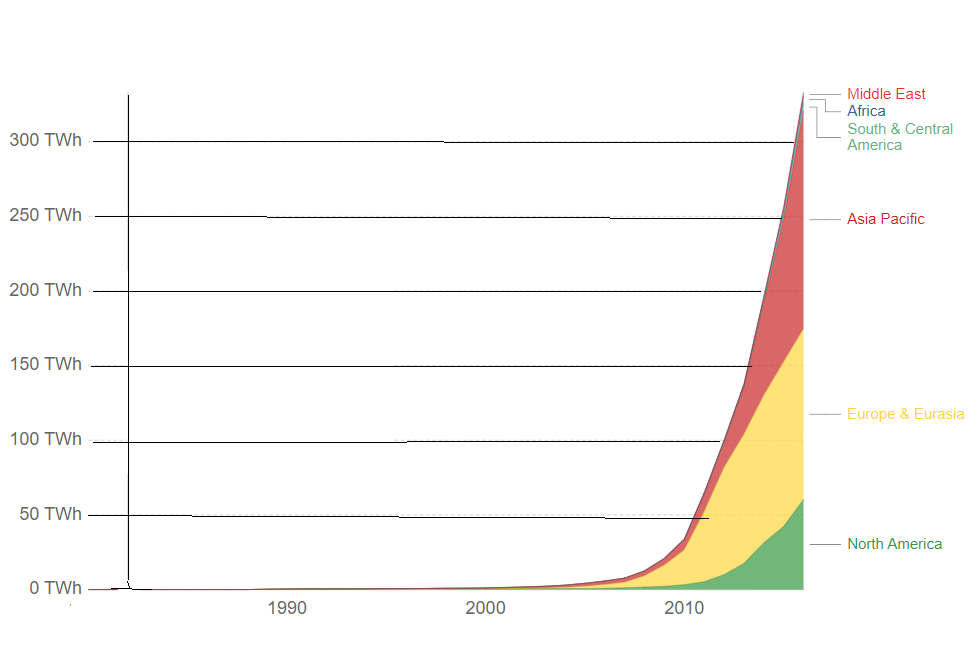
The growth of solar energy (Our world in data 2018)
One advantage that solar energy has over other forms of green energy is that it has an almost unlimited potential because of the vast amount of energy reaching the Earth from the Sun. If the problems of distribution and storage could be overcome, it would only be necessary to cover a small fraction of the Earth’s surface with solar panels to meet all of humanity’s energy needs.
To calculate the size of this area, the first thing we need to consider is the amount of solar radiation which actually reaches the Earth’s surface. Although the solar constant is 1,361 W/m2, this is the intensity of the radiation which hits the top of the Earth’s atmosphere. Even on a cloudless day not all this radiation reaches the ground; some is reflected back into space and some is absorbed by the atmosphere.
On a clear day, if the Sun is directly overhead, the intensity of the radiation hitting the ground directly from the Sun is around 1,050 W/m2, on top of this a further 70 W/m2 comes from the bright blue sky, giving a total of 1,120 W/m2.(If is it’s cloudy this figure will be lower.)

In fact, the Sun can be directly overhead only in the tropics. When the Sun is lower in the sky, the intensity of the solar radiation is reduced because its rays are spread out over a larger area and because they must pass through more atmosphere before they hit the ground. At night when the Sun is below the horizon the solar intensity is clearly zero.

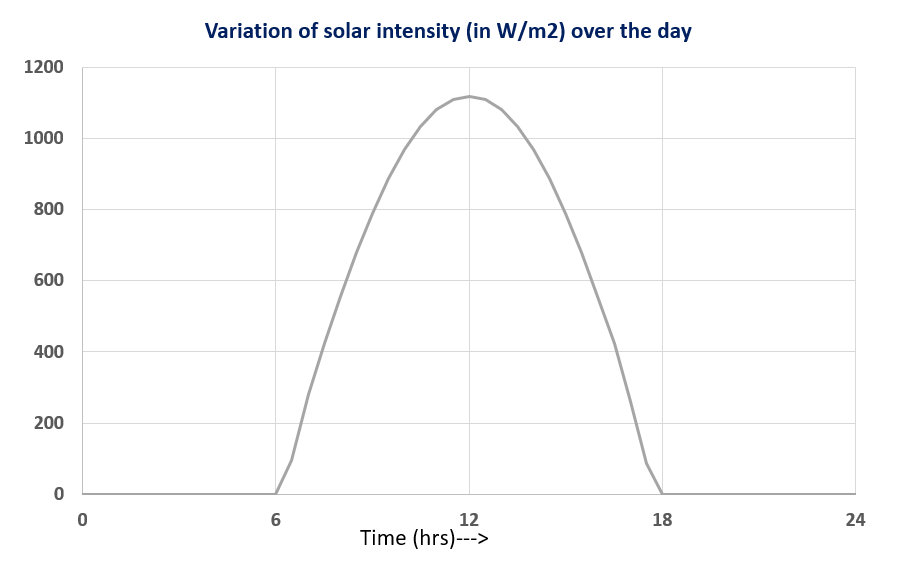
The diagram above shows the variation in the solar intensity at the equator, at an equinox when the Sun is directly overhead at midday. The time axis uses the solar time i.e. the Sun rises at 0600, is at its highest at 1200 and sets at 1800. A cloudless day is assumed.
If we average out over an entire 24 hour cycle the amount of solar radiation hitting the Earth’s surface (known as the solar irradiance) on a clear day at the equator on the equinox is approximately 340 W/m2. Back in 2018 when this post was originally written the most efficient solar panels on the market converted approximately 22% of solar irradiance to electrical energy. This means that, averaged over an entire 24 hour cycle, the solar electric power which could be generated is 73 W/m2, which is approximately 5% of the solar constant. At higher latitudes the Sun is lower in the sky and so the amount of solar electric power which could be generated is less. The amount of solar energy is reduced by cloud cover. For example, in the cloudy north west of Scotland the solar irradiance averaged out over a year is only 72 W/m2, about one fifth of its value at the equator.
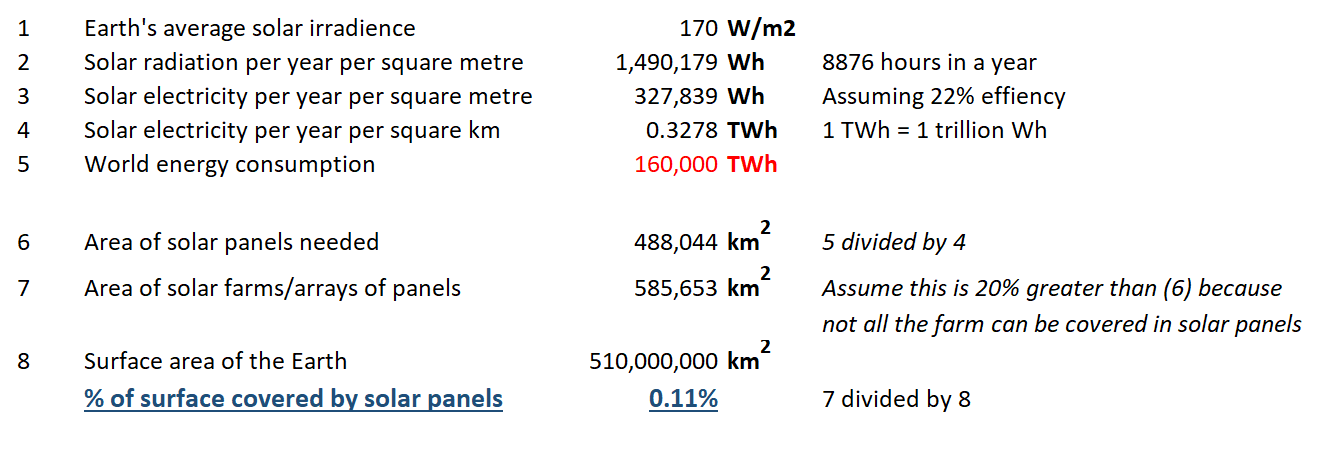
If averaged out over 12 months and over all locations on the Earth’s surface, then the average solar irradiance is 170 W/m2. This means that we would need to cover 586,000 square km of the Earth’s surface with solar panels to generate all the world’s energy needs, an area about 15% larger than Spain. The details of the calculation are given the notes at the bottom of this post. This number is relatively small, only 0.11% of the surface area of the Earth. However, the main issue is that countries which could generate the most solar energy (particularly those in Africa) actually have modest energy consumption and many densely populated countries, particularly those in Northern Europe, have high energy consumption and receive relatively little sunlight.
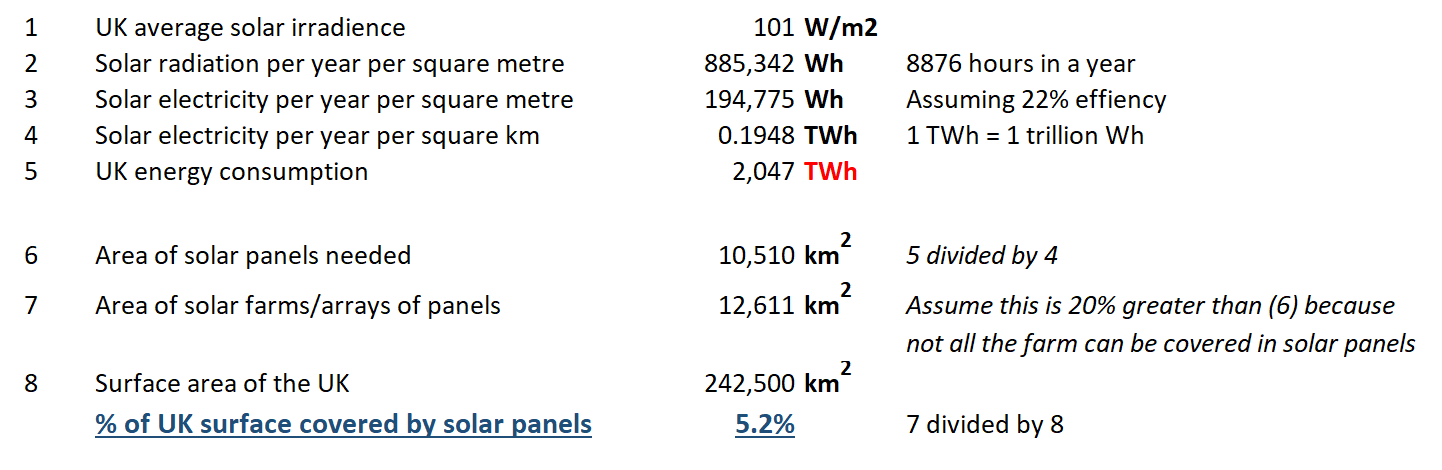
For example, the UK which has a small surface area, receives comparatively little sunlight compared to the world average, and is densely populated with a high energy consumption, we would need to cover about 5.2% of its surface with solar panels. (In fact this calculation is an oversimplification because it ignores large difference between the amount of radiation in the he summer and winter months.) For this to work the surplus energy generated in the sunny months would need to be efficiently stored to be consumed in the winter months, which would be a massive undertaking!!
Interestingly the UK is ideally placed for offshore wind farms and plans to generate 30% of its electricity in this manner by 2030.
Small scale solar power
At the moment, solar power not the largest renewable source of electricity. As shown in the chart below, in 2016 a total of 5,877 TWh was generated by renewables. Of this, the vast majority (4,023 TWh) was generated by hydroelectricity, followed by 960 TWh by wind; solar energy contributed 333TWh and the remaining 561 TWh by all other renewables combined.

From Our world in data (2018): the data excludes so called ‘traditional biofuels’ e.g. burning wood which may or may not be renewable
One clear advantage that solar power has is that it is possible to generate electricity on a small scale. A single panel four metres square attached to a rechargeable battery would be able to generate and store enough solar energy for lighting and cooking for a family in Africa. Solar panels have no moving parts and once purchased should work for decades. It is this ability to generate electricity on a small scale that may revolutionise the lives of some of the poorest people in world. This is a topic I discuss in Advantages of Solar Energy.
And finally
I hope you have enjoyed this post. If you would like to find out more about the Explaining Science blog, e-books or YouTube channel I have created a short video
Further Notes
Tilting solar panels
For small solar installation it is common to increase the average intensity of the sunlight by tilting the panel towards the Sun. For instance, small arrays of solar panels in the UK are often tilted to face south. It is clearly difficult to do this for the very large arrays of solar panels found on solar farms.
Calculation of the area for (a) the Earth and (b) the UK to generate all energy needs by solar panels
Note to calculation: In any large structure which generates solar electricity there must be gaps between the solar panels. In these calculations I have assumed that one sixth of the area of a solar farm/large array of solar panels is not covered by panels.
Calculation for the Earth
Calculation for the UK
For the UK, since it is a long way from the equator, there is large difference in the solar irradiance between the winter and the summer months. For a location near Manchester in Northern England the solar irradiance is around 300 W/m2 in in the middle of June but in December it is roughly ten times lower.
In the over simplistic calculation below, it has been assumed that the surplus energy generated in the summer months can be efficiently stored to be consumed in the winter months. In reality we are long way from be able to do this!
Data from Science Direct (2014) and Enerdata (2018)
References
Enerdata (2018) Global energy statistical yearbook 2018, Available at: https://yearbook.enerdata.net/total-energy/world-consumption-statistics.html (Accessed: 23 February 2019).
Our world in data (2018) Global renewable energy consumption over the long-run, Available at: https://ourworldindata.org/renewable-energy (Accessed: 23 February 2019).
Science Direct (2014) The UK solar energy resource and the impact of climate change, Available at: https://www.sciencedirect.com/science/article/pii/S0960148114002857(Accessed: 23 February 2019).
Williams, D. R. (2018) NASA Sun fact sheet, Available at: https://nssdc.gsfc.nasa.gov/planetary/factsheet/sunfact.html (Accessed: 8 March 2019).
Discover more from Explaining Science
Subscribe to get the latest posts sent to your email.

1 361 W/m2 x 1.2748 x 1014 m2 = 1.73 x 10¹⁷ watt-hours.
Isn’t that just watts? You have to multiply with 3600s to turn it into watt-hours right?
LikeLike
No multiplying it by 3600s would give the total energy hitting the Earth over a time period of 1 hour in the SI unit of joules (watt-seconds)
1 361 W/m2 x (1.2748 x 1014 m2 ) x 3600s = 6.23 x 10²⁰ watt-seconds
1 361 W/m2 x (1.2748 x 1014 m2 ) x 1 hour = 1.73 x 10¹⁷ watt-hours
gives the total energy hitting the Earth over a time period of one hour in the non SI unit of watt-hours
LikeLike
Isn’t the area of a circle: A = pi * r * r, where A is the area and r is the radius of the circle. Shouldn’t the formula be A = pi * 12,740 * 12,740? I don’t understand the 1/4.
LikeLike
Yes that’s true but 12 740 km is the diameter and the Area is (1/4)*pi*d*d 😉
LikeLike
Thanks for sharing this awesome article about solar energy facts and give all the helpful guidelines on this topic.
LikeLiked by 1 person
Thanks for sharing this article post about solar energy topic and give us the helpful guidelines and tips.
LikeLiked by 1 person
Thank you,
I would suggest it is worth reading the revised and updated version of this post https://explainingscience.org/2021/10/18/opportunities-for-solar-energy/
LikeLiked by 1 person
[…] Solar energy […]
LikeLike
[…] standard estimate is that the sun sends 1,361 watts per square meter every second to the Earth, which when spread out […]
LikeLike
[…] https://ifarm.fi/blog/2020/12/how-much-electricity-does-a-vertical-farm-consume Solar Energy https://explainingscience.org/2019/03/09/solar-energy/ Agricultural carbon sequestration […]
LikeLike
[…] Dacă am putea transforma în energie razele solare care ajung pe Pământ în fiecare oră, am asigura necesarul de energie electrică al întregii planete pentru un an. […]
LikeLike
[…] the sun emits more energy than the entire Earth consumes in a year. To put that into perspective, explaining science explained that every hour, the earth receives 173,000 TWh of energy from the sun, and in 2017, […]
LikeLike
Very informative article.
Do you have any latest article filled with interesting research on Solar Energy?
Thank you.
LikeLike
There is an updated version of this post available at
LikeLike
Thank you Steve for sharing the Updated version of this.
I’ll reading this 🙂
Also I’m finding very interesting ways how people are using Solar energy. Like some people are using special type of Windows instead of Panels to create electricity, some people are using Solar Bicycle 🙂 simply WOW! I never knew that their is a Solar Bicycle before.
LikeLike
[…] the sun emits more energy than the entire Earth consumes in a year. To put that into perspective, explaining science explained that every hour, the earth receives 173,000 TWh of energy from the sun, and in 2017, […]
LikeLike
The calculation above of the area required in the UK to generate all electricity from solar suffers from a big flaw. Generation capacity varies through the year and is at a minimum in winter, but electricity demand actually rises in the winter. The calculation would need to estimate what area of solar is required to satisfy the winter demand with the winter generation capacity, resulting in a much bigger area of solar being required.
LikeLike
Thank you for your comment. As you correctly point out, the UK receives a lower amount of solar irradiance in winter when the demand for energy is of course higher. As you get further from the equator the amount of solar energy available on the dates around the winter solstice gets less and less.
If you take an extreme case of a location around the Arctic Circle, for example, Iceland (which lies between the latitudes of 63 degrees and 66.5 degrees north) the amounts of solar electricity you could generate around the December solstice would be effectively zero. However, Iceland is of course blessed with a plentiful supply of geothermal energy.
I really meant the calculation for illustration purposes, to show just how much solar energy is available to be tapped into. Covering 5.2% of the UK’s surface would be able to provide its (2017) energy needs only if we could have an efficient way of storing surplus solar energy in the summer months to be utilised in the winter months. We are clearly a long way from doing so with our current technology (For clarity I will update the post to reflect this)
BTW I wrote this article back in March 2019 and intend to rewrite it with more up to date data sometime next year.
LikeLike
There is an updated and revised version of this post at:
LikeLike
[…] 586,000 square km (226,256 square miles) of the Earth’s surface with solar panels to generate all the world’s energy needs (here) […]
LikeLike
[…] Sun (173,000 TWh) in an hour than the whole of humanity consumes in a year (160,000 TWh). Click here for more facts about solar energy and details of its future potential. There are lots of tables, […]
LikeLike
[…] Source link […]
LikeLike
[…] Source link […]
LikeLike
Hello and thank you for that clear article. I liked the solar panel calculations – I wonder how “cost effective” panels are, if one deducts the energy needed to manufacture the panels, and also takes into account their working lifespan.
And if I dare ask another question – hope you continuing the solar theme in future articles… I’d be interested to understand how spectroscopic line data from the Sun is turned into pictures through rastering eg as in SOHO pictures.
LikeLiked by 1 person
You raise an interesting point about cost efficiency of solar panels and this is theme I will discuss in future posts. The cost of solar panels is falling and their reliability/maintenance costs and lifetime are increasing. The cost efficiency will also depend on the amount of sun they receive. In sunny areas they, will generate more solar power and thus be more cost effective.
The following link gives a rough indication of payback times in the UK
https://www.greenmatch.co.uk/blog/2014/08/what-is-the-installation-cost-for-solar-panels
In 2010 the UK government launched a scheme to encourage domestic householders to generate their own electricity by providing generous subsidies. These were known as ‘Feed-in Tariffs’ and are being discontinued for new installations on 31 March 2019.
On top of this UK domestic users who generate more solar electricity than they use can sell this excess energy to the national grid at a price of 4.77 pence (roughly $0.06) per kWh.
LikeLike